Challenge Info
This challenge will introduce you to ‘Anti-Debugging.’ Malware developers don’t like it when you attempt to debug their executable files because debugging these files reveals many of their secrets! That’s why they include a lot of code logic specifically designed to interfere with your debugging process. Now that you’ve understood the context, go ahead and debug this Windows executable! This challenge binary file is a Windows console application and you can start with running it using cmd on Windows. Challenge can be downloaded here. Unzip the archive with the password picoctf
This challenge is #1 of a 3 part series
next WinAntiDbg0x200
next WinAntiDbg0x300
Poking around
First, I tried to run the executable, but had no success:
1 | C:\Users\riv\Desktop\pico\WinAntiDbg0x100>WinAntiDbg0x100.exe |
For analyzing, I prefer Ghidra over x32dbg. Searching through program text for the word “flag” yields a few results.
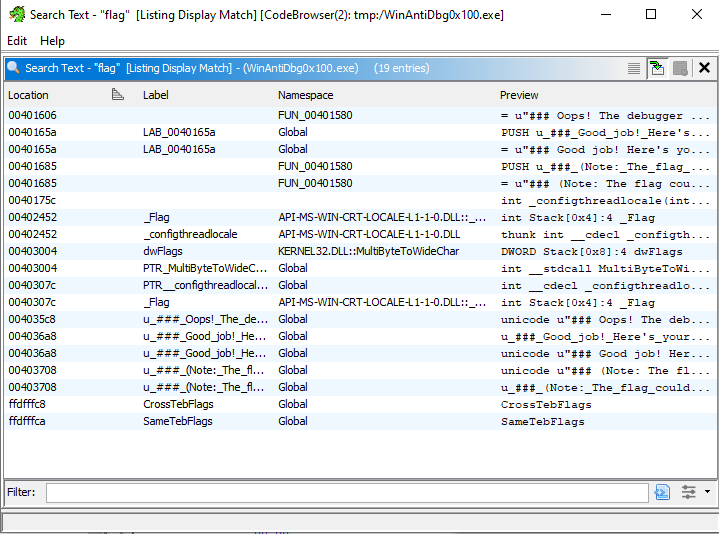
After jumping to them: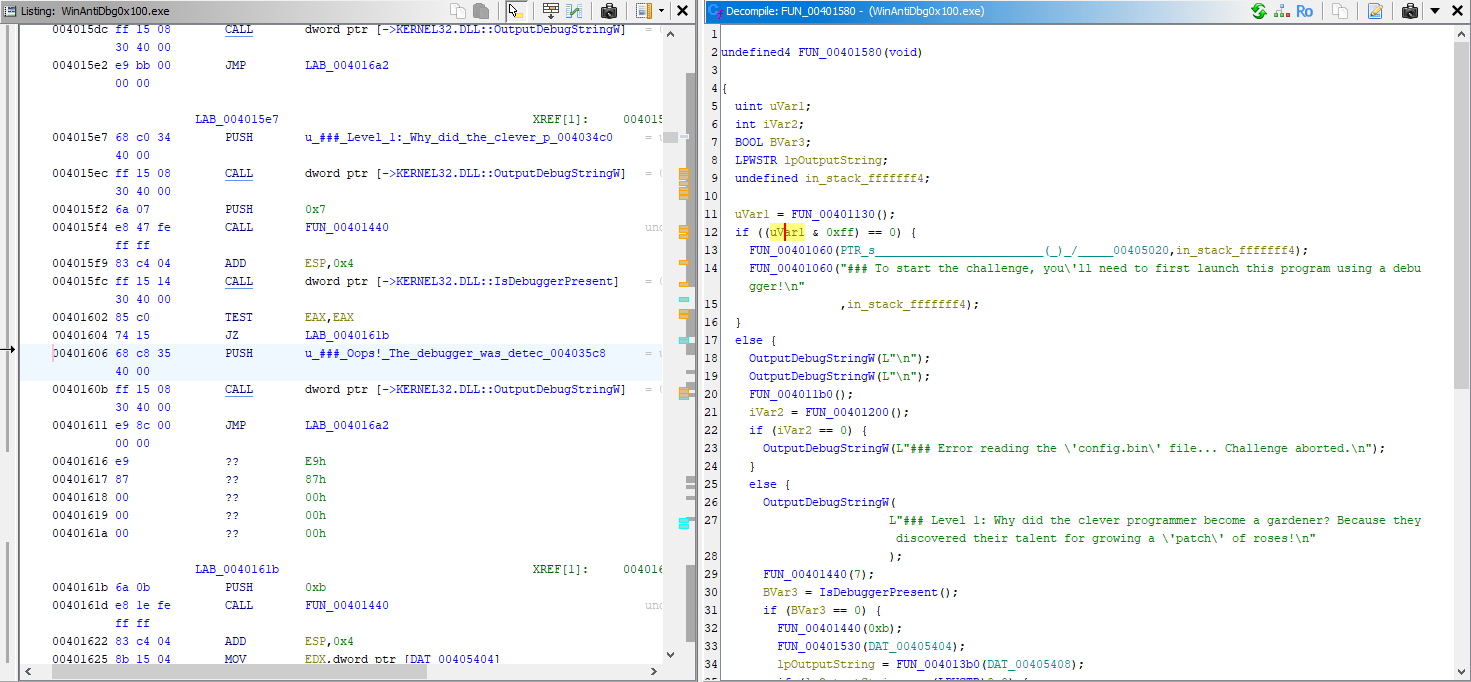
We notice function calls, conditional jumps, and debug checks.
Understanding the program
Let’s understand FUN_00401580, I’ve left the code below for your convenience:
1 | undefined4 FUN_00401580(void) |
Check #1
1 | uVar1 = FUN_00401130(); |
FUN_00401130()is called, it returns a value stored inuVar1. Then, the program checks whether(uVar1 & 0xff) == 0.- If true, the program prints a message prompting us to start it inside a debugger.
- If false, we continue.
Don’t worry about bypassing this, since we’ll have to use a debugger anyways.
Check #2
1 | BVar3 = IsDebuggerPresent(); |
This is the main anti-debugging check we need to bypass:
- The program calls
IsDebuggerPresent(), which returns True (nonzero) if a debugger is detected. - If no debugger is found
(BVar3 == 0), the program proceeds to retrieve and display the flag. - If a debugger is detected, the program prints
### Oops! The debugger was detected. Try to bypass this check to get the flag!.
Bypassing Check #2
In Ghidra, the if (BVar3 == 0) check corresponds to specific assembly instructions. If we look at the disassembly at address 00401602, we can see:
1 | 00401602 85 c0 TEST EAX,EAX |
Understanding the assembly:
TEST EAX,EAXperforms a bitwise AND of EAX with itself, setting the Zero Flag (ZF) if the result is zeroJZ LAB_0040161bjumps to the flag-displaying code if ZF=1 (meaning EAX=0, no debugger detected)- If the jump isn’t taken, the error message is displayed
To bypass this check, we’ll use x32dbg to:
- Open the program in x32dbg
- Find the TEST instruction
- Set a breakpoint at that instruction
- When the breakpoint hits, manually force the Zero Flag to be set
- Continue execution
When opening the program in x32dbg, the addresses will be different from Ghidra due to how Windows loads executables in memory (ASLR - Address Space Layout Randomization). To find the same instruction:
- In Ghidra, the entry point is at
00401923 - In x32dbg, the entry point might be at something like
006C1923 - The last 4 digits remain the same, so we can find our
TESTinstruction at006C1602in x32dbg
Once we find this instruction, we:
- Set a breakpoint at
006C1602, which is where theTESTinstruction lies - When it hits, edit the
EAXvalue under the FPU window to be 0, indicating that a debugger is NOT present - Continue execution and get our flag
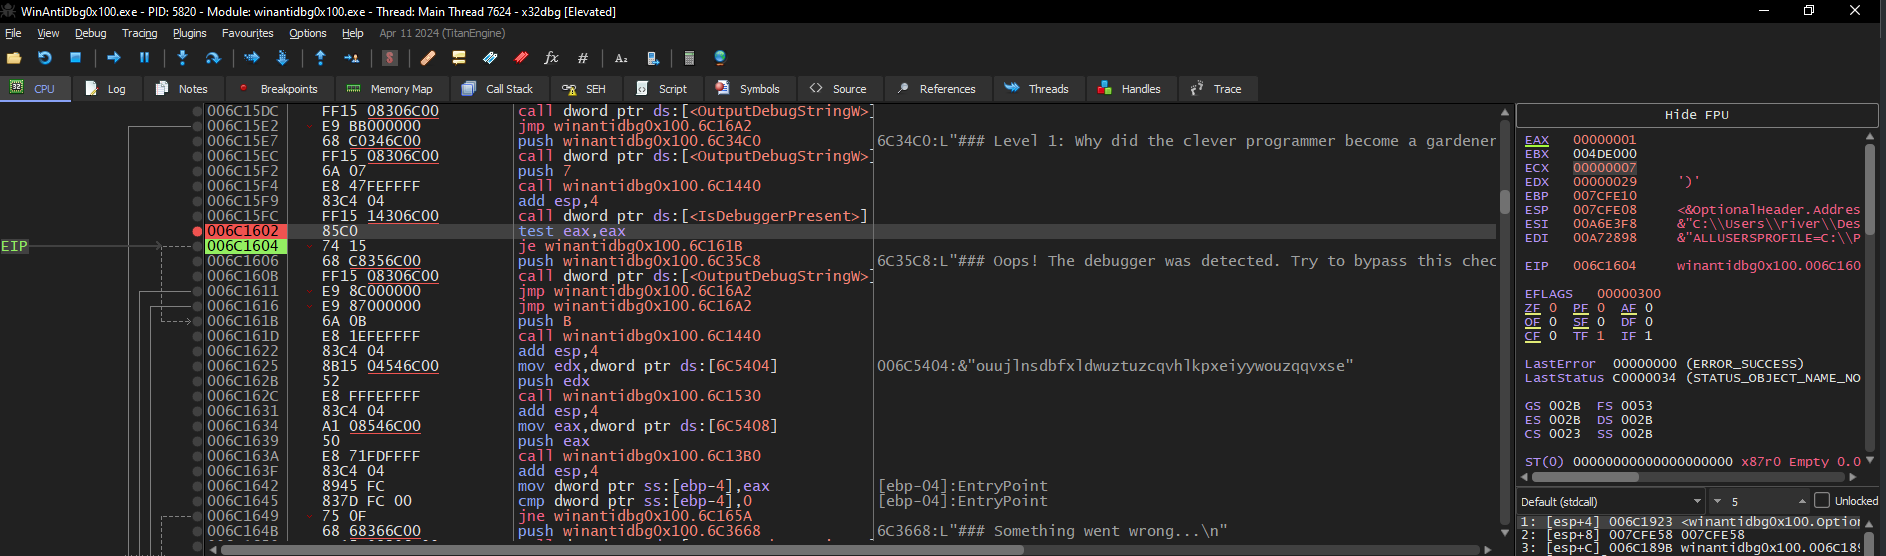
The flag will be under the “Log” tab.
flag: picoCTF{d3bug_f0r_th3_Win_0x100_cfbacfab}